Gaudy Gource
Fun things first, here’s the video I made with gource, an open source source code visualization tool:
It shows the history of the Node project as an animated tree.
Node.js is a platform built on Chrome's JavaScript runtime for easily building fast, scalable network applications. Node.js uses an event-driven, non-blocking I/O model that makes it lightweight and efficient, perfect for data-intensive real-time applications that run across distributed devices.
Directories appear as branches with files as leaves. Developers can be seen working on the tree at the times they contributed to the project. It’s a fun, whiz-bang, way to see the explosive growth of the project since 2009.
If you’re on a mac, and use the homebrew package manager, you can easily install gource by typing: brew install gource from the command line.
GitStats
Honestly, I usually don’t have the patience to sit through videos when I’m at work, and after trying gource, I wondered if there were any more useful tools for sifting through the data of the git commit logs. Enter GitStats. GitStats is what I was looking for, a multi-tabbed view of the data including average commits per day, age, activity by week, hour, day of week, month of week, top authors, file count and type, and tag statistics. Check out this graph of commits by month:
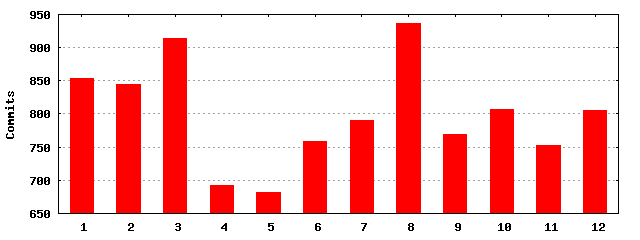
The above graph shows that historically, there have been the most commits in August, and then March. Are people working on Node on their summer vacation and spring break? What is up with April and May?
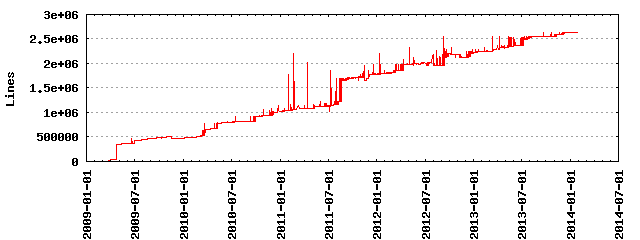
Above is the trend of the number of lines of code in the project. Ideally, you’d like to see not linear growth forever, but an asymptotic slow down, trending towards a stable code base. It looks like Node could be heading that way, just in the last six months.
If you’re on a mac, and use homebrew , you can install GitStats by typing: brew install gitstats from the command line
CodeFlower
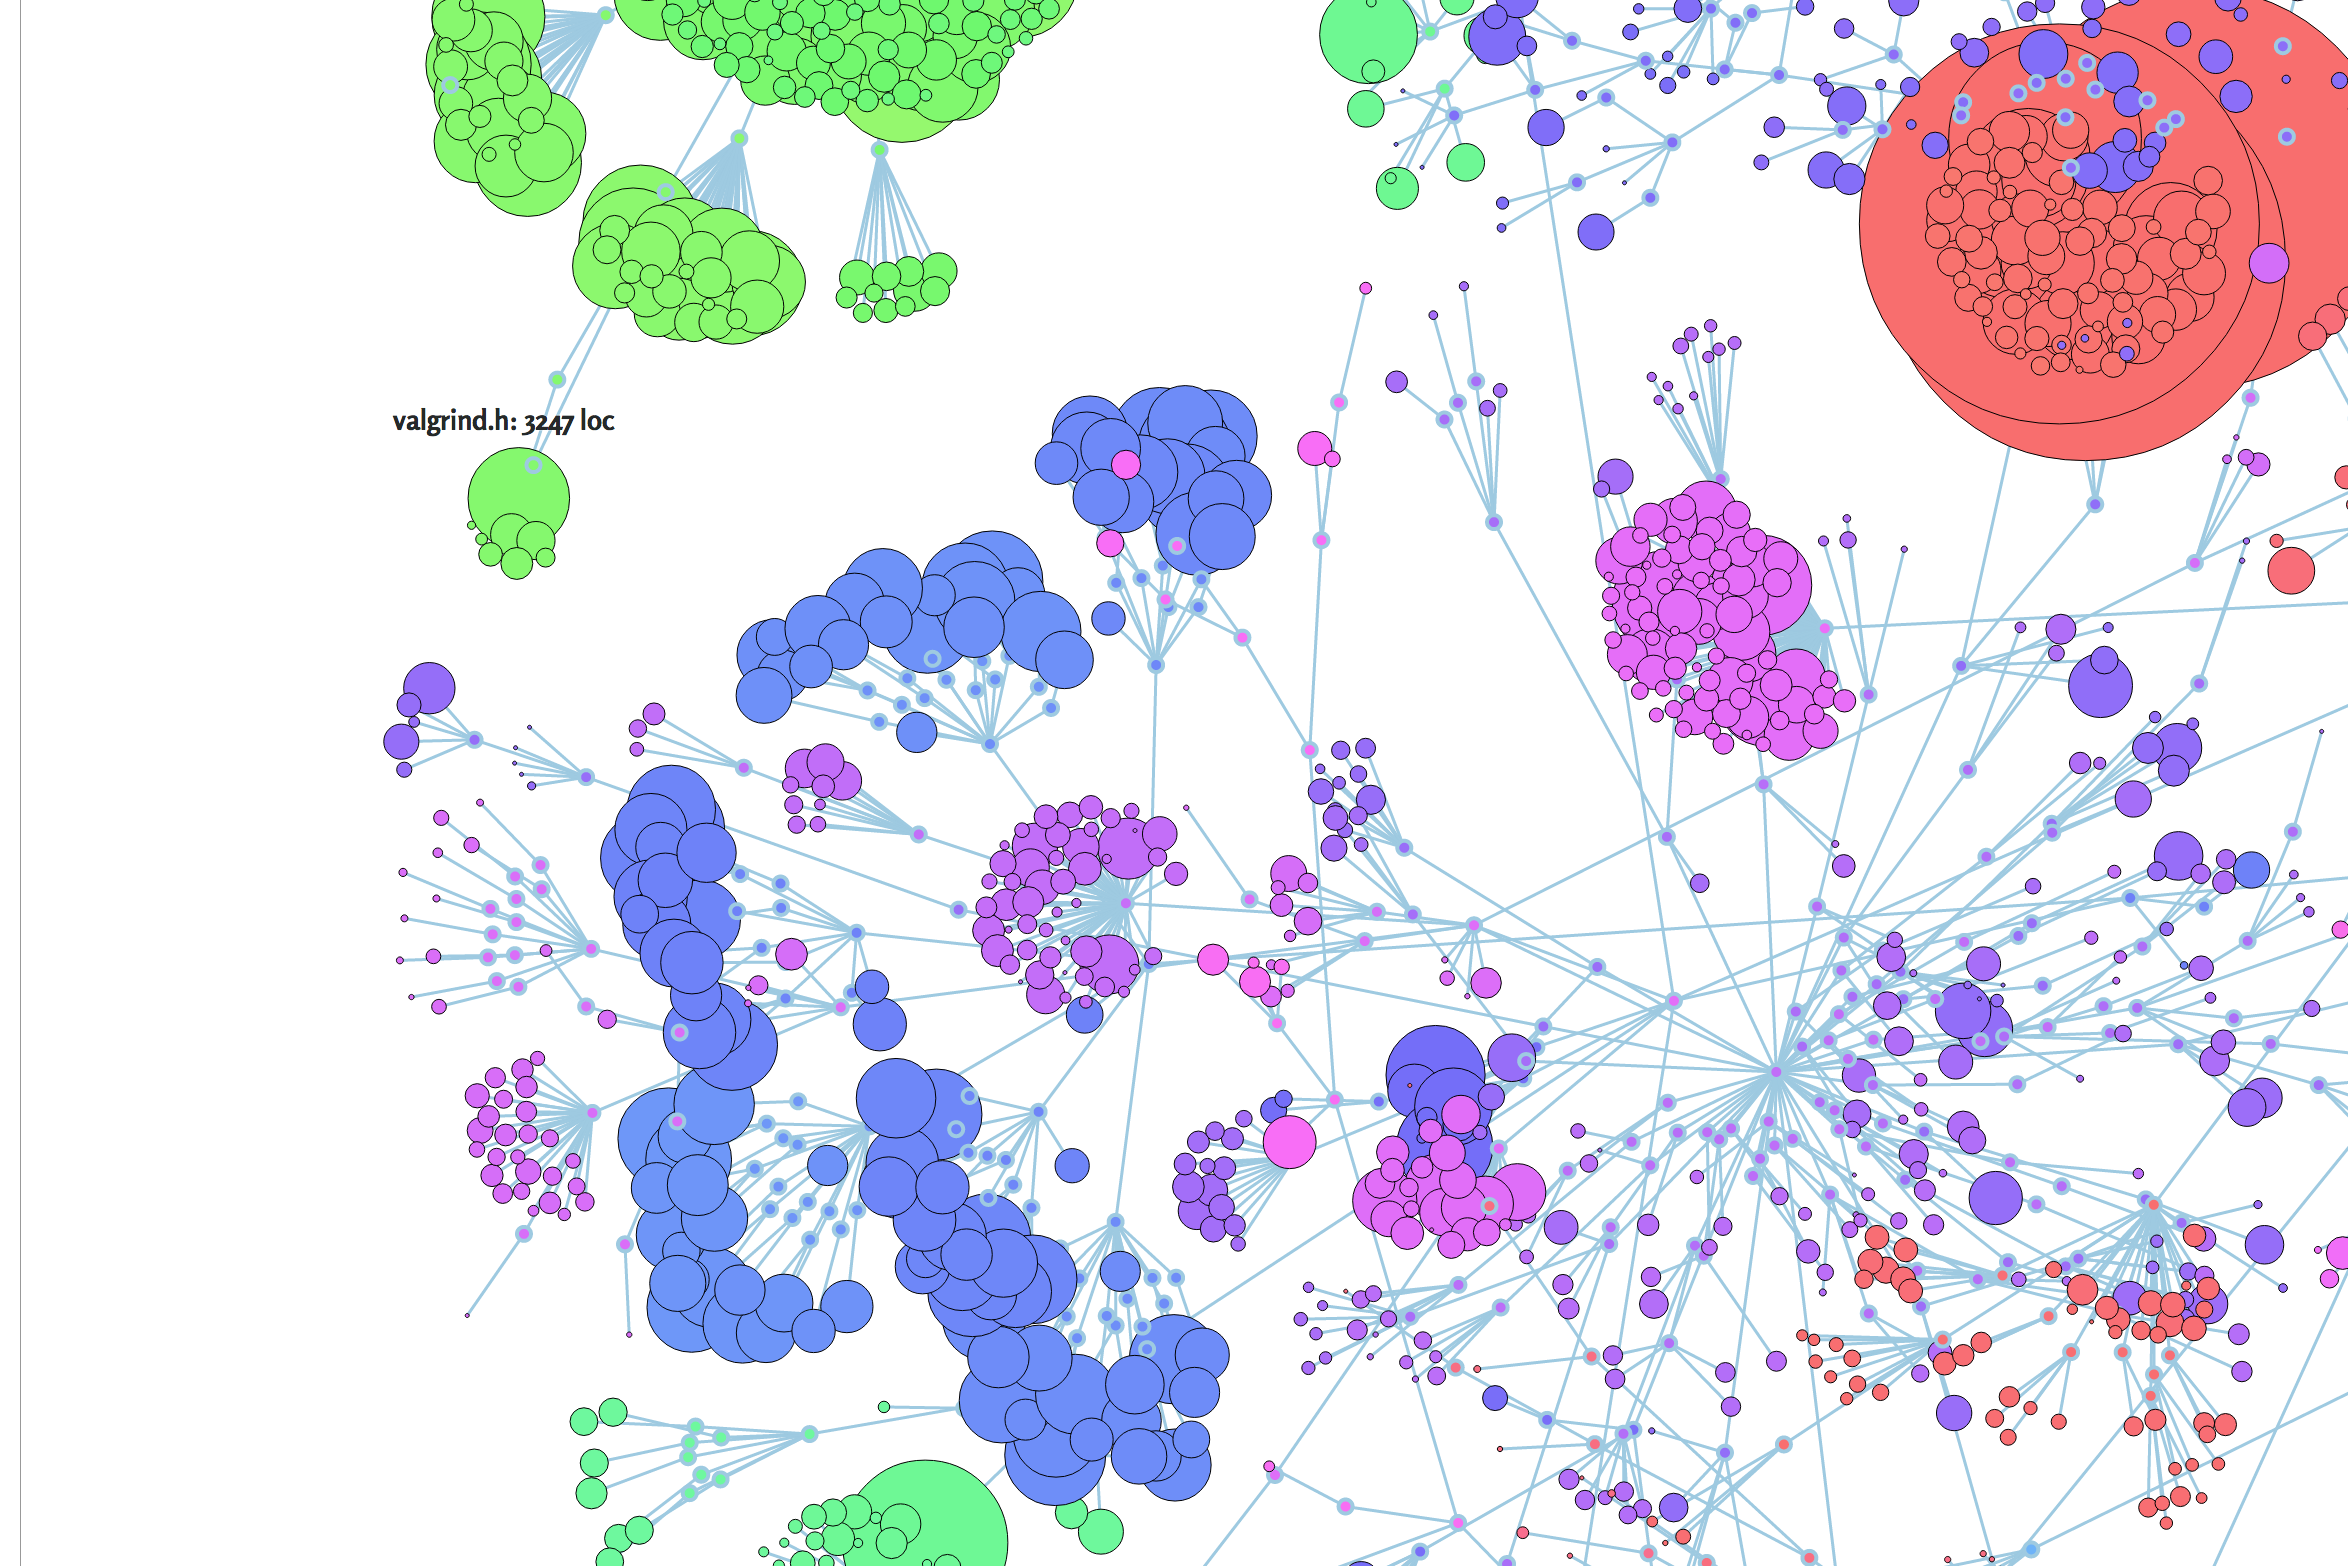
Of course, GitStats is useful, but not super-pretty. Kinda looks like a web page from 1999 actually. So this led me to look for a modern JavaScript solution, and I found CodeFlower.
This style of visualization for Node.js with D3.js is amazing. See the high-res version of the graphic above on this [GitHub page here].(http://codefellows.github.io/CodeFlower)
CodeFlower needs lines of code metrics to draw its charts. You’ll need an additional tool called cloc which can be installed via homebrew: brew install cloc.
Other Useful Tools
There are additional resources for examining and visualizing git commit history.
Check out Github’s graphs of the Node repo that are available on the project repository page.
Also available is Code Swarm, another video visualization tool.
Share Your Visualizations
Diving into D3.js is just one activity in our upcoming JavaScript Bootcamp. If you want to dive deeper into JavaScript, check out the bootcamp.